Carbon stock and Carbon fluxes at mull arable soils in Finland
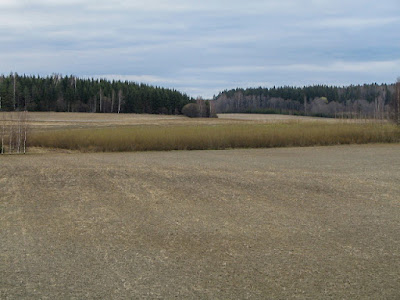
Carbon husbandry is looking for new methods how to increase the Carbon stock especially in the most fertile mull soils of arable lands. Continuous monoculture, for instance by cereals after cereals with regular plowing, reduces the humus content and correspondingly the elementary Carbon content. An intermediate Carbon husbandry solution is to grow cereals after cereals with direct sowing, without plowing. Also perennial crops (like Picture 1) and agroforestry methods have become more topical.

Carbon in agricultural fields, in arable lands has been measured by the Natural Resource Institute Finland (Luke) in a comparative manner, in several hundreds sample plots, by repeating the sampling four times since 1987 (ref 1). The basic measurement has been done for the content of elementary Carbon in dry soil (g C/kg).
The measurements have been done in three soil classes: mineral soil, mull soil and peat soil. The classification is based on the share of dry weight organic (humus) soil in the total soil dry weight. In mineral soil the the share is less than 20 per cent. In mull soil the share is between 20 - 40 per cent. In peat soil the share is more than 40 per cent.
The Carbon content (cc) in mull soils in arable lands, is shown in Figure 1.

Figure 1. Development of Carbon concentration in mull arable fields, in 15 cm topsoil layer.
The Carbon concentration 150 g/kg (dry soil) equals 150 000 ppm (parts per million). It can be compared with the Carbon share in the dry biomass. That is quite accurately 500 000 ppm. Carbon share in mull soils is clearly more than the Carbon content in mineral soils, 35 000 ppm .
Besides Carbon content (cc, g C/kg dry soil), the Carbon stock (tn C/ha/15 cm) calculation needs the bulk density (bd, kg/m3) and the soil volume in 15 cm layer, in one hectare (V = 1500 m3). The bulk density is on average depending on Carbon content over the equation (1).
(1) bd = 1.52 - 0.280 * ln(cc/10) (ref 2)
Thus the Carbon stock (c) in arable mull lands over one hectare in 15 cm depth can be estimated as
(2) c = bd * V
The development of Carbon stock in Finnish mull soil arable fields is shown in Figure 2.

After 1998 there is an apparent tendency downwards. The future prediction can be done either with linear regression or with 2nd degree polynomial regression. In the linear option the coefficient of determination (R^2, squared) is 49.7 %, in the 2nd degree option 98.5 %.
The carbon stock equation (3) for the 2nd degree curve is
(3) c(t) = -0.056281 * t^2 + 224.89 * t - 224453
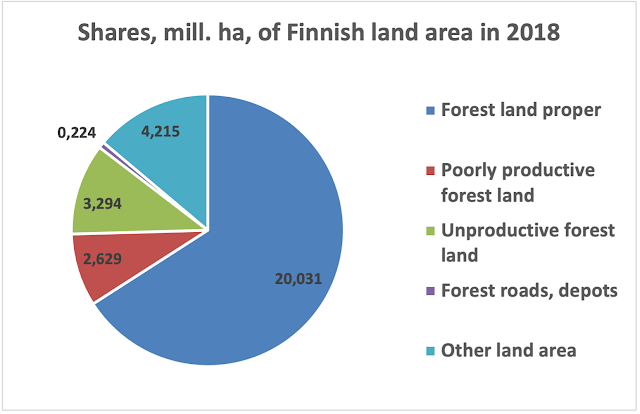
The mull soil arable fields Carbon stock level 170 - 200 tn C/ha/15 cm is clearly more than the average forest carbon stock (tree stems, branches, foliage and roots) in Finnish forest lands. It is 36,3 tn C/ha.
By derivating the Carbon stock equation (3) we will get the Carbon flux (4)
(4) d (c(t)) / dt = -0.1126 * t + 224.9
The development of Carbon flux in mull arable soils is shown in Figure 3.

Figure 3. Carbon flux in mull soils arable lands
In 1990s the Carbon flux seems to have been positive sink flux into mull soils. After that the the flux has turned into negative Carbon emissions flux (Figure 3). In 2020 the calculated Carbon emissions flux (source flux) from average mull soil arable land is -2490 kg C/ha/a/15 cm. It also compares with the Finnish forests. The calculated average (positive) carbon sink flux in 2020 to a forest hectare is 393 kg C/ha/a.
The Carbon fluxes from the mull mineral soils can also be referred to the value of Carbon dioxide emissions. At the end of 2020 it was 30 Euros per ton CO2 (Ref 4). It equals with 110 Euros per ton C. The (negative) value of arable soil Carbon emission is thus
-2.490 tn C/ha/a * 110 Euros/tn C = - 274 Euros/ha/a
Correspondingly, the (positive) value of average forest Carbon sink fluxes is
+0.393 tn C/ha/a * 110 Euros/tn C = +43.2 Euros/ha/a
References
Ref 1: Luke. Carbon content in arable soil.
Ref 2: Heikkinen et al 2013. Declining trend of carbon in Finnish cropland soils in 1974–2009.

Kommentit
Lähetä kommentti