Dry biomass and the annual biomass growth in Finnish forests since 1921
In the Carbon husbandry with trees, and forests in general, it is logical to add the treetop, the branches (including the foliage) and the roots into the stock of the solid stems. The total biomass is most logical to estimate in dry tons. The basic measurement also for Sink Forests is in the stems, as solid cubic meters in one stem, or solid cubic meters per one hectare.
As the measurement series has only three time point data sets, it is logical to use in further calculations the averages from those time points. The average amount for solid cubic meters was 2438 mill. m3 (for 2356, 2475 and 2438 million cubic meters). Correspondingly, the average total forest dry biomass was 1715 million tons (for 1668, 1744 and 1733 million tons).
Figure 2. Development of the total amount of dry biomass (stems, branches, foliage, roots) in Finnish forests
The annual growth of dry biomass in Finnish forests can be calculated as the derivative of the dry biomass equation.
(3) db/dt = 2A * t + B
The calculated annual tree dry biomass growth is shown in Figure 2. for instance in 2019 was 21,2 million tons.
Figure 3. Forest trees dry matter growth (stems, branches, roots) in Finland as calculated from Figure 2 and the corresponding regression equation (2).
 |
| Picture 1. Cubic meters easily measurerable in Scots pine forest in South Finland (Kiikala) |
In the Finnish forest inventory series between 1921 - 2019 the total biomass stock (in dry tons) has been measured three times for the periods NFI 11 (2009-2013), NFI 12 (2014-2018) and NFI 12/13 (2015-2019). With normal statistical sampling plots this was done together with the normal solid cubic meters inventory.
 |
| Picture 2. Shares of solid cubic meters in tree classes in the three last Forest inventories (NFI 11 - NFI 13). |
The Finnish forests are typically coniferous forests. They cover 80 per cent of the total solid volume stock (Picture 2). Scots pine covers the share 50 % and Norway spruce 30 %.
The division between coniferous and deciduous total volumes is important from the point of view of Carbon Sink Forests. Coniferous trees have a little higher Carbon content in dry biomassa that the deciduous trees. On the other hand, deciduous trees have a little more biomass in branches and roots as the coniferous trees.
The total dry biomass 1715 million tons was shared in the stems 991 million tons, in the branches including foliage 340 mill. tons, and in the roots including the stumps 385 million tons. The per cent shares are shown in Figure 1.
Mathematically, the solid cubic meters in the stems (s, cubic meters) can be converted into total dry biomass (b, tons) with a coefficient, with the Biomass Multiplier (BM).
(1) b = BM * s
Calculated as average from the Finnish forest inventories NFI 11, NFI 12 and NFI 13 the Biomass Multiplier is
BM = 0.70354 tn/m3
The development of calculated forest dry biomass from 1921 in Finland is shown in Figure 2. Logically, the curve follows the shape of the curve of total solid cubic meters over the same time.
The coefficients of the 2nd degree polynomial regression equation
(2) b = A * t^2 + B * t + C
are
A = 0.12639
B = -489,82
C = 475537
(b = dry biomass in mill. tn, t = year, t^2 = t squared)
The regression, R-squared value is 0.98544. It is the same as for solid cubic meters.
 |
| Figure 1. Shares in total biomass |
Mathematically, the solid cubic meters in the stems (s, cubic meters) can be converted into total dry biomass (b, tons) with a coefficient, with the Biomass Multiplier (BM).
(1) b = BM * s
Calculated as average from the Finnish forest inventories NFI 11, NFI 12 and NFI 13 the Biomass Multiplier is
BM = 0.70354 tn/m3
The development of calculated forest dry biomass from 1921 in Finland is shown in Figure 2. Logically, the curve follows the shape of the curve of total solid cubic meters over the same time.
The coefficients of the 2nd degree polynomial regression equation
(2) b = A * t^2 + B * t + C
are
A = 0.12639
B = -489,82
C = 475537
(b = dry biomass in mill. tn, t = year, t^2 = t squared)
The regression, R-squared value is 0.98544. It is the same as for solid cubic meters.
The annual growth of dry biomass in Finnish forests can be calculated as the derivative of the dry biomass equation.
(3) db/dt = 2A * t + B
The calculated annual tree dry biomass growth is shown in Figure 2. for instance in 2019 was 21,2 million tons.
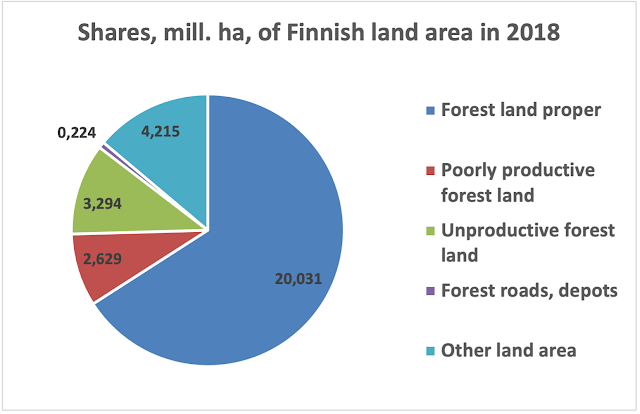
In the year 2020 the calculated forest dry biomass growth was 20.8 million tonnes. In 2020 the total forest land area in Finland is 26.215 mill. ha. Thus the annual dry biomass growth was 793 kg/ha/a. The national dry biomass annual growth in the forest trees can be compared for instance to the annual dry biomass harvest of cereals (grains) in Finland. Totally (wheat, rye, oats, barley, as summed) it was 3.24 million tons in 2020. As a rough reference it means that the Finnish forests grow annually dry biomass about six times more than the annual cereals (grains) production in Finland. *** The original calculation from 24.4.2020 was updated after the Natural Resources Institute Finland (Luke) released (13.11.2020) the updated information on Finland forest resources by region: https://stat.luke.fi/en/forest-resources-region_en-3 |


Kommentit
Lähetä kommentti