Solid cubic meters of forest trees and their annual growth in Finland since 1921
At national level the most remarkable above ground Carbon stock in Finland is in the forests. The most common basic measurement for the forests, is the amount of above ground solid cubic meters in the trees. It is normally measured for the stems only.
The data correlates strongly with the total dry biomass in the trees (stems, branches, foliage, stumps and roots). Further, the solid cubic meters data correlates strongly with the amount of elementary Carbon in the trees (stems, branches, foliage, stumps and roots).
The solid cubic meter stock of trees was diminishing in Finland until late 1930s. After that the data shows a continuous increasing stock. In late 2010s the growing stock of Finnish forest is roughly at level of 2500 million solid cubic meters.
The data in Figure 1 can be processed with regression analysis. There are altogether 12 forest inventory data points between 1921 and 2019. For only 12 data points it is logical to use the linear, the 2nd degree polynomial, the third degree polynomial or the exponential regression. The corresponding R-squared values are: linear 0,8593, 2nd degree polynomial 0,9856, 3rd degree polynomial 0,9864 and exponential 0,9136.
(1) s(t) = A * t^3 + B * t^2 + C * t + D
s is stems solid cubic meters, in million cubic meters; t is time, the year; t^3 is t raised to 3rd degree, t^2 is t squared
The coefficients are
A = 0.00062221
B = -3.5012372
C = 6561.19
Currently, the solid cubic meters stock in Finland is increasing from year to year. The net annual forest growth comprises the gross growth of the trees from which the annual harvests and the annual natural decay of old or otherwise dying trees have been deducted. In 2021 the calculated total solid cubic meters stock in Finnish forests is 2640 million cubic meters.
The annual forests solid cubic meter growth (mill. m3/a) in Finland (Figure 2) can be calculated (Eq. 2) as the derivative from the solid cubic meters stock equation (Eq. 1).
(2) ds/dt = 3A * t^2 + 2B * t + C

 |
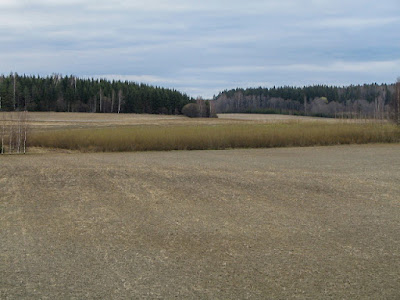
| Photo 1. Boreal forests are a remarkable Carbon stock in Finland. |
The changes in the amount of solid cubic meters in the trees indicate the changes in the Carbon stock. Positive change tells about the Carbon sink flux into the forests. Negative change tells about the Carbon source flux (or Carbon emissions flux) from the forests.
The regular inventory of forest trees, for their solid cubic meters, has been done in Finland since 1921 (Figure 1). The latest National Forest Inventory (NFI 13, or VMI 13) has been done for the period 2018-2022. The median year 2018 for NFI 13 is used in the Figure 1. Similar median year definition for the other inventories has been us as well.
The regular inventory of forest trees, for their solid cubic meters, has been done in Finland since 1921 (Figure 1). The latest National Forest Inventory (NFI 13, or VMI 13) has been done for the period 2018-2022. The median year 2018 for NFI 13 is used in the Figure 1. Similar median year definition for the other inventories has been us as well.
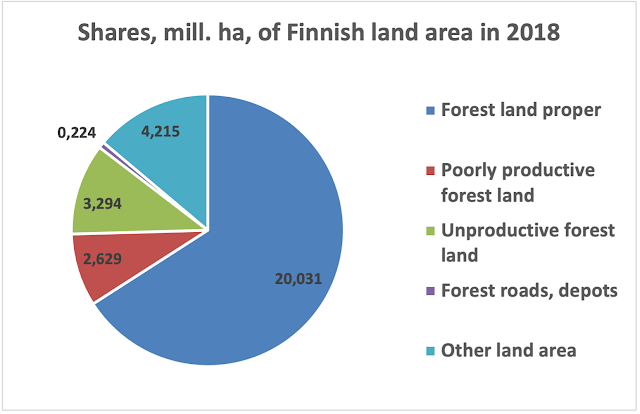
The forest inventory data has been measured from the Forestry land categories of Forest Land (productive) and Poorly productive forest land, not from the Unproductive (forest) land or elsewhere. Thus the forest inventory data is the data for Sink Forests in Finland. More about Sink forests in the link.
The statistical data and more explanations on the measurements can be found in the web-link of Luke - Natural Resource Institute Finland.

The solid cubic meter stock of trees was diminishing in Finland until late 1930s. After that the data shows a continuous increasing stock. In late 2010s the growing stock of Finnish forest is roughly at level of 2500 million solid cubic meters.
Conifers (Scots pine - Pinus sylvestris and Norway spruce - Picea abies) cover 80.0 per cent of the total solid cubic meters (Figure 2). Deciduous trees (Birches - Betula sp., Aspen - Populus tremula and other broadleaved trees) cover 20.0 per cent.
 |
| Figure 2. Solid volume shares between main tree species in Finnish forests. |
The data in Figure 1 can be processed with regression analysis. There are altogether 12 forest inventory data points between 1921 and 2019. For only 12 data points it is logical to use the linear, the 2nd degree polynomial, the third degree polynomial or the exponential regression. The corresponding R-squared values are: linear 0,8593, 2nd degree polynomial 0,9856, 3rd degree polynomial 0,9864 and exponential 0,9136.
By R-squared value the best is the 3rd degree polynomial equation (Eq. 1).
(1) s(t) = A * t^3 + B * t^2 + C * t + D
s is stems solid cubic meters, in million cubic meters; t is time, the year; t^3 is t raised to 3rd degree, t^2 is t squared
The coefficients are
A = 0.00062221
B = -3.5012372
C = 6561.19
D = -4093045
Currently, the solid cubic meters stock in Finland is increasing from year to year. The net annual forest growth comprises the gross growth of the trees from which the annual harvests and the annual natural decay of old or otherwise dying trees have been deducted. In 2021 the calculated total solid cubic meters stock in Finnish forests is 2640 million cubic meters.
The annual forests solid cubic meter growth (mill. m3/a) in Finland (Figure 2) can be calculated (Eq. 2) as the derivative from the solid cubic meters stock equation (Eq. 1).
(2) ds/dt = 3A * t^2 + 2B * t + C
Figure 3. Forest trees growth in Finland as calculated from Figure 1 and the corresponding regression equation (2)
The calculated annual (net) growth of forests in Finland has been positive since the year 1934. In the year 2021 the calculated net annual growth is 33,0 million cubic meters per year. The number of annual growth has been increasing from year to year.
In the year 2021 the calculated area of Sink Forests in Finland is 22,70 million hectares. Correspondingly, the mean annual net growth per Sink Forest hectare is 1,49 m3/ha/a.
The total land area of Finland is 30.392 million hectares in 2018 (World Bank / FAO). Correspondingly, the mean annual net growth per Land hectare is 1,12 m3/ha/a.
The annual net growth indicates that the forests are also a considerable Carbon stock. In one hand the current positive and increasing derivative (Figure 2) tells that the Carbon stock in Finnish forests is increasing from year to year. On the other hand it tells that there is still capacity to increase the annual harvest from Finnish Carbon Husbandry forests.
***
The original calculation from 24.4.2020 was updated on 15.12.2020 after the Natural Resources Institute Finland (Luke) published (13.11.2020) the updated information on Finland forest resources by region:
***
5th update, after Luke 2023 update of VMI 13 (2018-2022)
4th update, including the concept and area of Sink Forests, on 11.4.2021
3rd update, calculation from 2nd degree regression to 3rd degree regression, on 3.4.2021
2nd update, mainly Figure 2, on 10.3.2021
Kommentit
Lähetä kommentti