Tekstit

Näytetään blogitekstit, joiden ajankohta on toukokuu, 2020.

Reference Carbon fluxes in Finnish Carbon husbandry

Kuva
The important, key fluxes in Finnish Carbon husbandry are the two: (1) positive Carbon sink flux to Finnish forests and (2) negative Carbon emissions (source) flux from Finnish arable lands. The most accurate data in Finland have been measured for (1) in Finnish forests. In the year 2020 there is the calculated average Carbon sink flux to Finnish forests of magnitude +393 kg C/ha/a.  Picture 1. Coppicing Downy birch - promising tree species for boreal Carbon husbandry in peatlands The most accurate data for Finnish arable lands (2) has been measured for mineral soils. In the year 2020 there is the calculated average Carbon emissions flux from Finnish arable lands of magnitude -430 kg C/ha/a. (Figure 1). Figure 1. Reference Carbon fluxes. Sink fluxes positive, source (emissions) fluxes negative. There is still less comprehensive measurement series for Carbon emissions from arable lands on peat soils. However, it is assumed that the emissions from a peat arable hectare are about 10...

Forest Carbon number and Forest Carbon flux, per forest hectare, in Japan since 1966

Kuva
Forest carbon number for a special year tells how many tons of elementary Carbon per forest hectare, there are stored in the trees - in solid stems, branches, foliage and roots. Forest carbon number can be calculated at besides national level, also at farm forest level, at regional forests level, as well as at global forests level. In the following example the calculation have been done for Japan at national level. Forest carbon number is calculated by dividing the total carbon stock (c, tn C) at certain time point (t, years) with the forest land area (fl, hectares) of the selected area. fc(t) = c(t) / fl(t) Carbon stock (c, million tons elementary Carbon)) equation for Japanese forests is c(t) = 0. 23646* t^2 - 917,09 * t + 889688 Forest land (fl) equation is fl(t) = -0.0071347* t + 39.324 The development of forest carbon number (fc) for Japanese forests is shown in Figure 1. Figure 1. Development of Forest carbon number (fc) in Japan since 1961. The average Forest carbon number f...

Carbon stock and Carbon fluxes at mull arable soils in Finland

Kuva
Carbon husbandry is looking for new methods how to increase the Carbon stock especially in the most fertile mull soils of arable lands. Continuous monoculture, for instance by cereals after cereals with regular plowing, reduces the humus content and correspondingly the elementary Carbon content. An intermediate Carbon husbandry solution is to grow cereals after cereals with direct sowing, without plowing. Also perennial crops (like Picture 1) and agroforestry methods have become more topical. Carbon in agricultural fields, in arable lands has been measured by the Natural Resource Institute Finland (Luke) in a comparative manner, in several hundreds sample plots, by repeating the sampling four times since 1987 (ref 1). The basic measurement has been done for the content of elementary Carbon in dry soil (g C/kg). The measurements have been done in three soil classes: mineral soil, mull soil and peat soil. The classification is based on the share of dry weight organic (humus) soil in the ...

Forest Carbon and Forest Carbon flux in Kainuu region

Kuva
Picture 1. The forests in Kainuu region are typically coniferous forests, under practical silviculture Kainuu region is geographically a central or central-eastern region in Finland. It is forested, scarcely populated region. Forestry is an important source of livelihood in the region. The amount of solid cubic meters in 2011 in Kainuu forests was 163 million cubic meters and 172 million cubic meters in 2016. Correspondingly, the area of forest hectares was 1.930 million hectares and 1.928 million hectares in 2011 and 2016, respectively (NFI 11 and NFI 12 inventories). With average Carbon Multiplier CM = 0.35314 tn C/m3 the total Carbon stock (stems, branches, foliage, roots) in Kainuu was 57.6 million tons in 2011 and 60.7 million tons in 2016. Forest carbon number is calculated by dividing the total carbon stock (c, tn C) at certain time point (t, years) with the forest land area (fl, hectares) at certain time point, for the selected area. (1)     fc(t) = c(t) / fl...

Carbon stock in and Carbon fluxes at mineral soil arable lands in Finland

Kuva
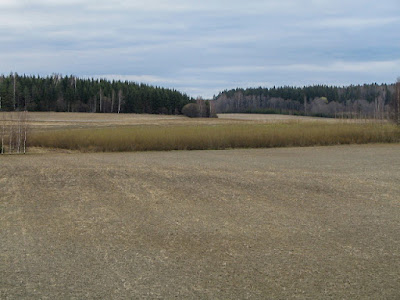
Carbon in agricultural fields belongs to the most topical research sectors for climate change in 2020s. Carbon husbandry is searching for new methods how to increase the Carbon stock in the soil. Also perennial crops and agroforestry methods have become more topical, like possibility of willow husbandry in new era farms (Picture 1).  Picture 1. Annual and perennial crop blocks in the agriculture Carbon in agricultural fields, in arable lands has been measured by the Natural Resource Institute Finland (Luke) in a comparative manner, in several hundreds sample plots, by repeating four times, since 1987 (ref 1). The basic measurements have been done for the content of elementary Carbon in dry soil (g C/kg). The measurements cover three soil classes: mineral soil, mull soil and peat soil. The classification is based on the share of dry weight organic (humus) soil in the total soil dry weight. In mineral soil the organic share is less than 20 per cent. In mull soil the share is between ...

Forest Carbon number and Forest Carbon flux at regional level (North Ostrobothnia) in Finland

Kuva
Forest Carbon number and Forest Carbon flux can be calculated at regional level similarly as at National level. In Finland the current (2020) available regional data of National Forest Inventories (NFI), however, is restricted only to two latest NFIs, for the periods 2009-2013, (central year 2011) and 2014-2018 (central year 2016). The regional data restriction is merely due to 1994 administrative decision to redefine the borders of Finnish regions in a new manner. After the reform the amount of Finnish regions is 19 . Let us take as example for calculations the region Pohjois-Pohjanmaa - North Ostrobothnia . By geography it is in central Finland. The amount of solid cubic meters  in North Ostrobothnia forests was 240 million cubic meters in 2011 and 263 million cubic meters in 2016. Correspondingly, the area of forest hectares was 3.244 million hectares and 3.235 million hectares in 2011 and 2016, respectively (NFI 11 and NFI 12 inventories). With average Carbon Multiplier ...

Forest Carbon number and Forest Carbon flux, per forest hectare, at national level, in Finland since 1921

Kuva
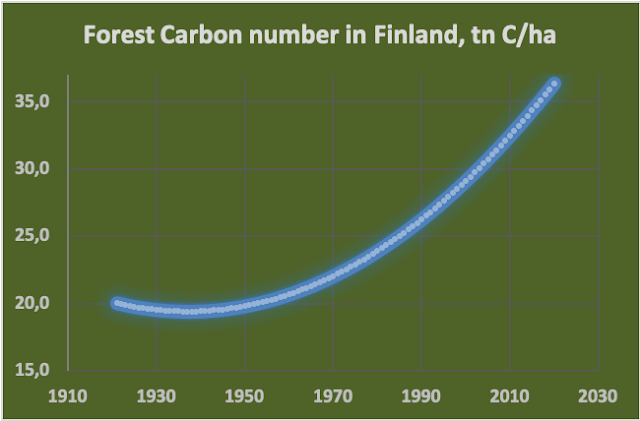
Forest carbon number for a special year tells how many tons of elementary Carbon there is per forest hectare. The Carbon is stored in the trees, including the solid stems, the branches, the foliage and the roots. Forest carbon number can be calculated at various categories level like at farm forest level, at regional forests level, at national forests level and at global forests level. Forest carbon number (fc) is calculated by dividing the total carbon stock (c, tn C) at certain time point (t, years) by the forest land area (fl, hectares) over the selected category. (1)      fc(t) = c(t) / fl(t) At Finnish national level the Carbon stock (c) equation is (2)     c(t) = 0.06460  * t^2 - 250.40 * t + 243136 Consequently, the forest land (fl) equation is (3)     fl(t) = -0.006073 * t + 38.46 The development of forest carbon number (fc, equation 1) for Finnish forests is shown in Figure 1. Figure 1. Development of Forest car...

Development of the land area of Sink Forests in Finland since 1921

Kuva
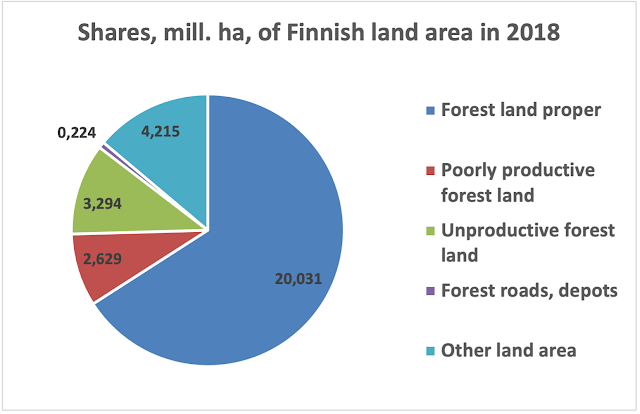
The definition of Forestry land in Finland is based on the volume growth of existing, living trees in the selected area - or on the potential volume growth in same area if there has been for instance a temporary forest clear cut in the area. In the standard silviculture the area is waiting for replanting or for natural recovery, in a few (less than 10) years. The Forestry land has been divided into four categories (Figure 1). First, when the average volume growth (stems only) is more than one solid cubic meter per hectare per annum, the land area is called Forest land. Second, when the average volume growth is between 0.1 - 1.0 m3/ha/a the land area is called Poorly productive forest land. Third, when the average growth is less than 0.1 m3/ha/a the land area is still included in the main category of forestry land but it has been nominated as Unproductive (forest) land. Fourth, under the main Forestry category there is still a minimal forestry land class called Forest roads and depots....